Forecasting
Let's create a forecast of the future web traffic using Holt-Winters method. This example was inspired by Richard Fergie.
# forecasting using Holt-Winters algorithm
# based on http://www.eanalytica.com/r-for-web-analysts/
# install libraries
# install.packages("googleAuthR")
# install.packages("googleAnalyticsR")
# install.packages("tidyverse")
# install.packages("forecast")
# install.packages("reshape2")
# load libraries
library("googleAuthR")
library("googleAnalyticsR")
library("tidyverse")
library("forecast")
library("reshape2")
# authorize the connection with Google Analytics servers
ga_auth()
## pick a profile with data to query
#ga_id <- account_list[275,'viewId']
# or give it explicite using tool http://michalbrys.github.io/ga-tools/table-id.html in format 99999999
ga_id <- 00000000
gadata <- google_analytics(id = ga_id,
start="2016-05-01", end="2016-06-30",
metrics = "sessions",
dimensions = "date",
max = 5000)
timeseries <- ts(gadata$sessions, frequency=7)
components <- decompose(timeseries)
plot(components)
# note the way we add a column to the data.frame
gadata$adjusted <- gadata$sessions - components$seasonal
theme(axis.text.x = element_text(angle = 90, hjust = 1))
forecastmodel <- HoltWinters(timeseries)
plot(forecastmodel)
forecast <- forecast.HoltWinters(forecastmodel, h=26) # 26 days in future
plot(forecast, xlim=c(0,13))
forecastdf <- as.data.frame(forecast)
totalrows <- nrow(gadata) + nrow(forecastdf)
forecastdata <- data.frame(day=c(1:totalrows),
actual=c(gadata$sessions,rep(NA,nrow(forecastdf))),
forecast=c(rep(NA,nrow(gadata)-1),tail(gadata$sessions,1),forecastdf$"Point Forecast"),
forecastupper=c(rep(NA,nrow(gadata)-1),tail(gadata$sessions,1),forecastdf$"Hi 80"),
forecastlower=c(rep(NA,nrow(gadata)-1),tail(gadata$sessions,1),forecastdf$"Lo 80")
)
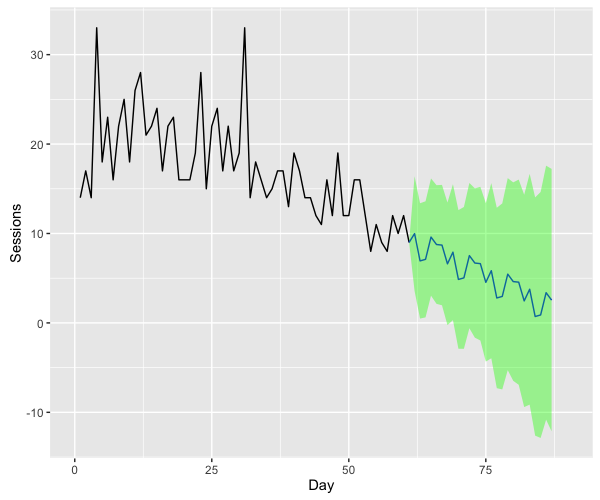
forecastdata %>%
ggplot( aes(x=day)) +
geom_line(aes(y=actual),color="black") +
geom_line(aes(y=forecast),color="blue") +
geom_ribbon(aes(ymin=forecastlower,ymax=forecastupper), alpha=0.4, fill="green") +
xlim(c(0,90)) +
xlab("Day") +
ylab("Sessions")
Result
As a result you'll get a chart with predictions of your web traffic.
Source code
The complete source code of the examples showed above is in my GitHub repository:
https://github.com/michalbrys/R-Google-Analytics/blob/master/4_forecasting.R