Device comparsion
Let's check how users are engaged on different types of device. To do this, we'll plot 2 charts:
- Describing how many
sessionswere made from different types of devices - What is
avgSessionDuration(in seconds) on a particular device type.
# device comparsion

# install libraries
# install.packages("googleAuthR")
# install.packages("googleAnalyticsR")
# install.packages("tidyverse")

# load libraries
library("googleAuthR")
library("googleAnalyticsR")
library("tidyverse")

# authorize the connection with Google Analytics servers
ga_auth()

## pick a profile with data to query
#ga_id <- account_list[275,'viewId']

# or give it explicite using tool http://michalbrys.github.io/ga-tools/table-id.html in format 99999999
ga_id <- 00000000

gadata <- google_analytics(id = ga_id,
                           start="2015-01-01", end="2016-06-30",
                           metrics = c("sessions", "avgSessionDuration"),
                           dimensions = c("date", "deviceCategory"),
                           max = 5000)


# plot sessions with `deviceCategory`
gadata %>%
ggplot(aes(deviceCategory, sessions)) +
  geom_bar(aes(fill = deviceCategory), stat="identity")

# plot avgSessionDuration with `deviceCategory`
gadata %>%
ggplot(aes(deviceCategory, avgSessionDuration)) +
  geom_bar(aes(fill = deviceCategory), stat="identity")
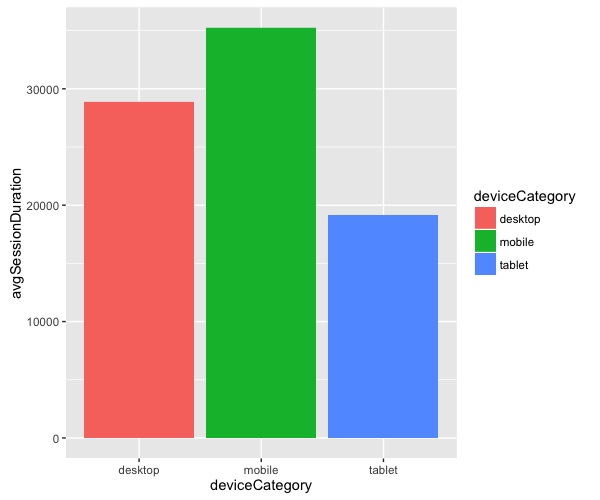
In this case the longest sessions were made from mobile devices.
Source code
The complete source code of the examples showed above is in my GitHub repository:
github.com/michalbrys/R-Google-Analytics/blob/master/7_device_comparsion.R