Clustering (k-means)
The power of R is based on a wide range of packages with advanced algorithms ready-to-use. In this example we'll use the k-means algorithm for custom users segmentation.
Unsupervised learning: k-Means k-means clustering aims to partition n observations into k clusters in which each observation belongs to the cluster with the nearest mean (Source: Wikipedia)
Because this example needs a custom installation of Google Analytics tracking (content grouping, fingerprint), I've prepared a special dataset for this purpose. You can find the complete code below.
# K-Means Cluster Analysis

# load data into R
# you can download data from Google Analytics API or download the sample dataset
# source('ga-connection.R')

# download and preview the sample dataset
download.file(url="https://raw.githubusercontent.com/michalbrys/R/master/users-segmentation/sample-users.csv",
              "sample-users.csv",
              method="curl")
gadata <- read.csv(file="sample-users.csv", header=T, row.names = 1)
head(gadata)

# clustering users into 3 groups
fit <- kmeans(gadata, 3)

# get the cluster means
aggregate(gadata,by=list(fit$cluster),FUN=mean)

# append and preview the cluster's assignment
clustered_users <- data.frame(gadata, fit$cluster)
head(clustered_users)

# visualize the results in 3D chart

#install.packages("plotly")
library(plotly)

plot_ly(clustered_users,
        x = clustered_users$beginner_pv,
        y = clustered_users$intermediate_pv,
        z = clustered_users$advanced_pv,
        type = "scatter3d",
        mode = "markers",
        color=factor(clustered_users$fit.cluster)
)

# write the results to the file
write.csv(clustered_users, "clustered-users.csv", row.names=T)
Results
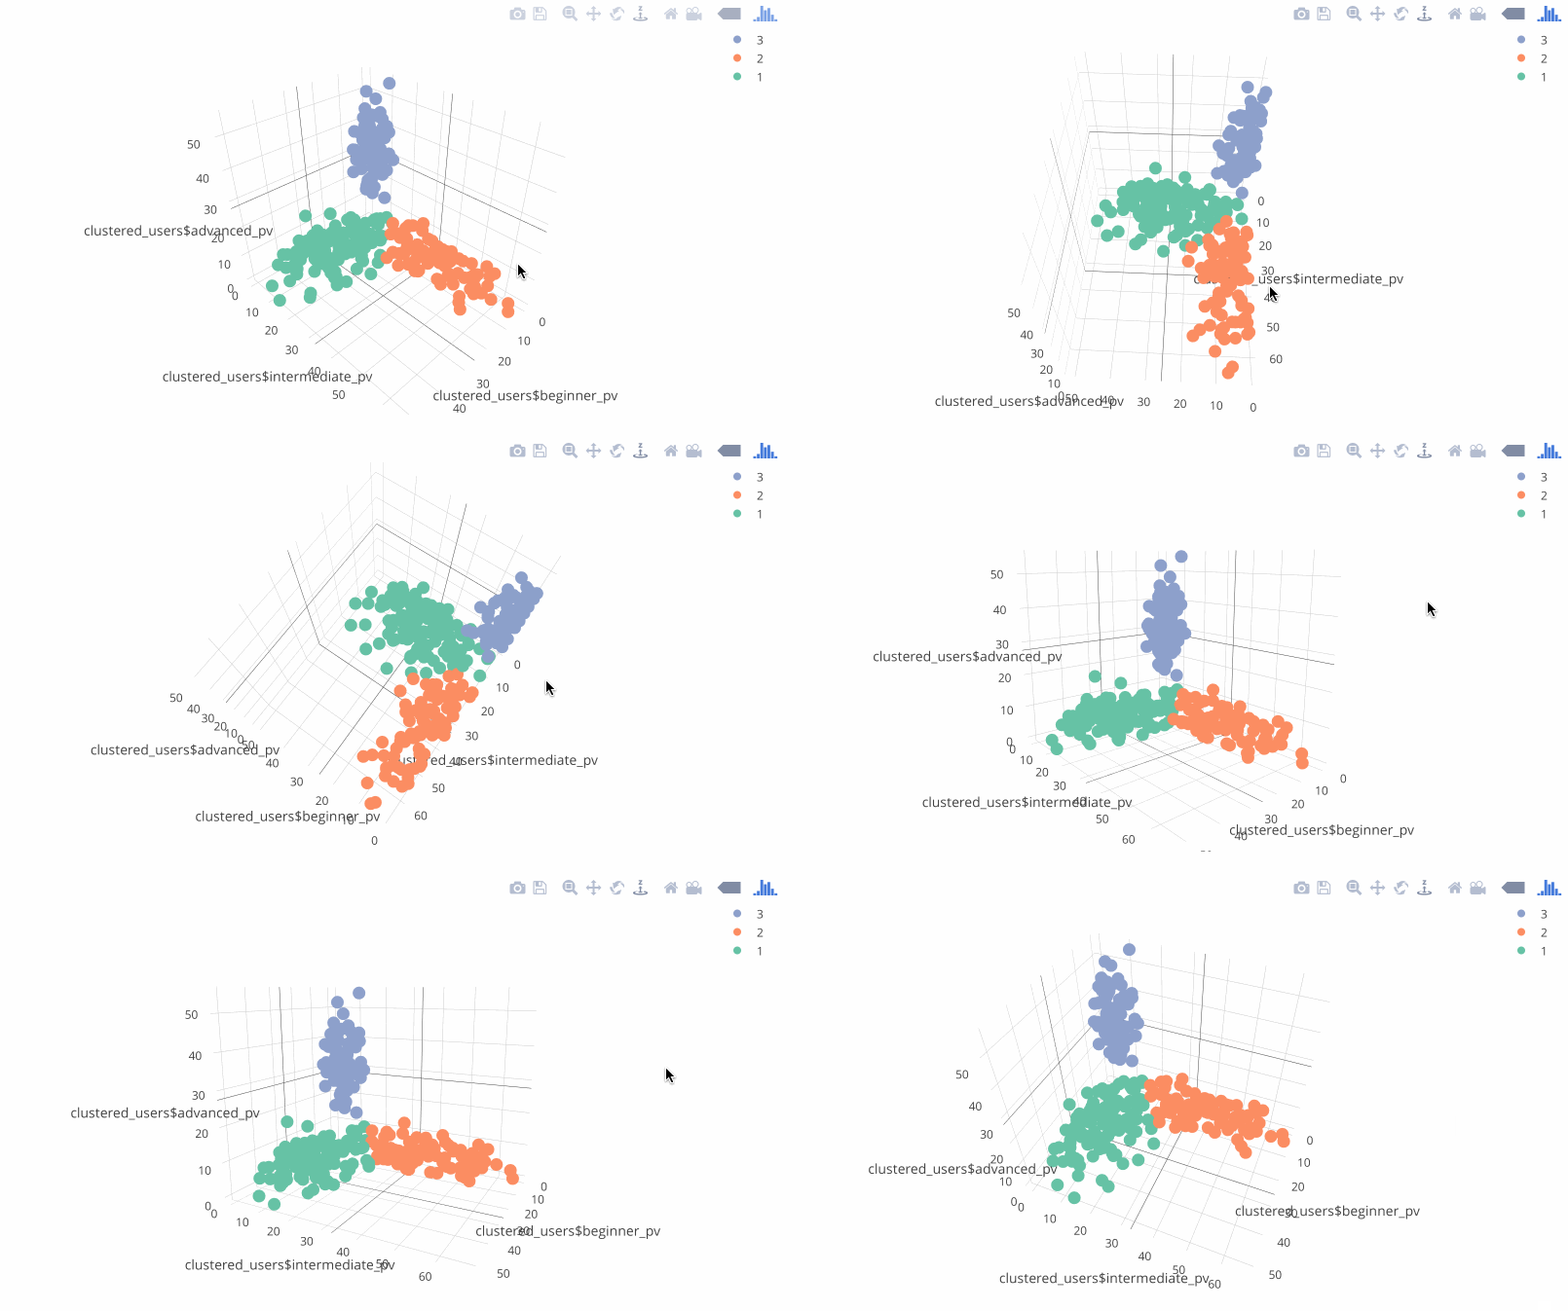
The results visualized in the plotly package:

Results - clustered users
In addition to the chart, you get a .csv file with the userId (fingerprint) and predicted label (the segment number). You can use the results, uploading it to your marketing systems. Example of the results:
> clustered_users

               Beginner     Intermediate     Advanced  fit.cluster
266876                 9                 45            4           1
965265                 9                 51            7           1
...
981924                19                 10            8           2
732529                19                 16            1           2
...
377795                2                   7            38           3
918083                2                   8            28           3
Source code
The complete source code of the examples showed above is in my GitHub repository:
github.com/michalbrys/R-Google-Analytics/blob/master/5_users_segmentation.R