Create a report
To generate a basic report template use this code. This report will contain a title and the scatter plot from chapter 2 (Data visualization in R) of number of sessions against time.
Create new RMarkdown report
In R Studio, navigate to File > New file > R Markdown.
You will see a window with some basic configuration options. Change those values or you can do that later directly in the code.

You can select the output of your report. Select HTML,PDF or Word.
Click OK and delete the sample code.
Prepare custom report with Google Analytics data
Copy this code to R Studio and click Knit HTML icon. This code will generate HTML report with data downloaded from Google Analytics.
---
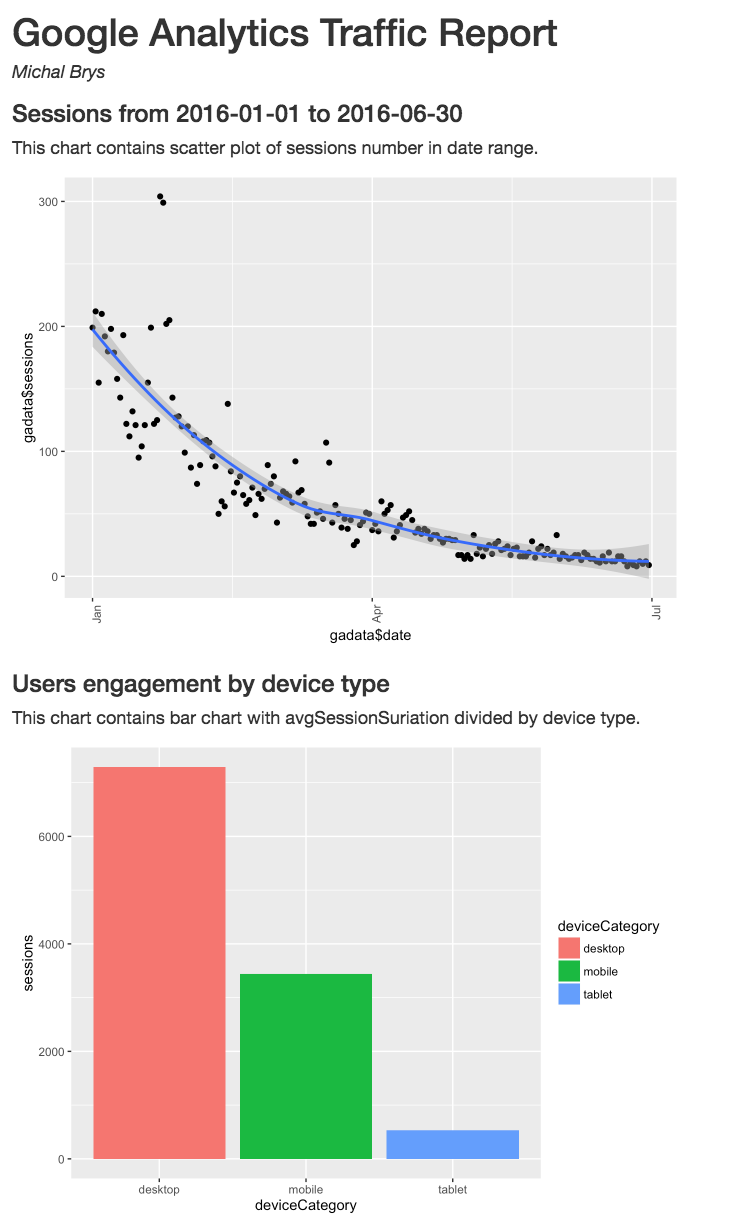
title: "Google Analytics Traffic Report"
author: "Michal Brys"
output: html_document
---
```{r, echo=FALSE, warning=FALSE,error=FALSE, message=FALSE }
ga_id <- 67980704
date_start <- "2016-01-01"
date_end <- "2016-06-30"
#install.packages("googleAnalyticsR")
#install.packages("tidyverse")
#install.packages("googleAuthR")
library("googleAnalyticsR")
library("tidyverse")
library("googleAuthR")
#Run once from the console, then generate knitr document
ga_auth()
```
### Sessions from `r date_start` to `r date_end`
This chart contains the scatter plot of number of sessions against date range.
```{r, echo=FALSE, warning=FALSE,error=FALSE, message=FALSE }
gadata <- google_analytics(id = ga_id,
start= date_start, end= date_end,
metrics = c("sessions"),
dimensions = c("date"),
max = 5000)
# scatter plot with a trend line
gadata %>%
ggplot(aes(x = gadata$date,y = gadata$sessions) ) +
geom_point() +
geom_smooth() +
theme(axis.text.x = element_text(angle = 90, hjust = 1))
```
### Users engagement by device type
This chart contains a bar chart with avgSessionSuriationdivided by device type.
```{r, echo=FALSE, warning=FALSE,error=FALSE, message=FALSE }
gadata2 <- google_analytics(id = ga_id,
start= date_start, end= date_end,
metrics = c("sessions", "avgSessionDuration"),
dimensions = c("date", "deviceCategory"),
max = 5000)
#plot sessions against deviceCategory
gadata2 %>%
ggplot(aes(deviceCategory, sessions)) +
geom_bar(aes(fill = deviceCategory), stat="identity")
#plot avgSessionDuration against deviceCategory
gadata2 %>%
ggplot(aes(deviceCategory, avgSessionDuration)) +
geom_bar(aes(fill = deviceCategory), stat="identity")
```
Results
As a result you'll get a complete HTML file with a report. You can also generate PDF file.
For recurring reporting you can only change dates :)
Source code
The complete source code of the examples showed above is in my GitHub repository:
github.com/michalbrys/R-Google-Analytics/blob/master/8_rmarkdown_report.Rmd